Data Preparation & Integration

BuildTrustworthy, Unified Data for Reliable Insights
Before data can drive decisions, it must be accurate, clean, and accessible. At CDF Analytics, we specialise in preparing and integrating data from diverse sources to form a single, reliable foundation for analysis and visualisation. Whether your data comes from spreadsheets, SaaS platforms, cloud databases, or APIs, we ensure it’s structured, consistent, and analysis-ready.
Why Data Preparation Is Critical
Garbage In, Garbage Out: Poor-quality data leads to unreliable insights.
Time Savings: Automated pipelines eliminate the need for manual cleanup
Scalability: Structured data scales with your business and reporting needs.
Consistency: Create standardised definitions and logic across platforms.
Speed to Insight: Clean, integrated data gets to dashboards faster.
Our Core Services
Data Auditing & Assessment
Identify inconsistencies, duplication, gaps, and reporting risks
Understand your data sources, file types, formats, and storage location
Data Cleaning & Transformation
Standardise formats (dates, currencies, product names, user IDs)
Remove duplicates and outliers, fix incomplete or inconsistent records
Normalise naming conventions and join logic for accurate merges
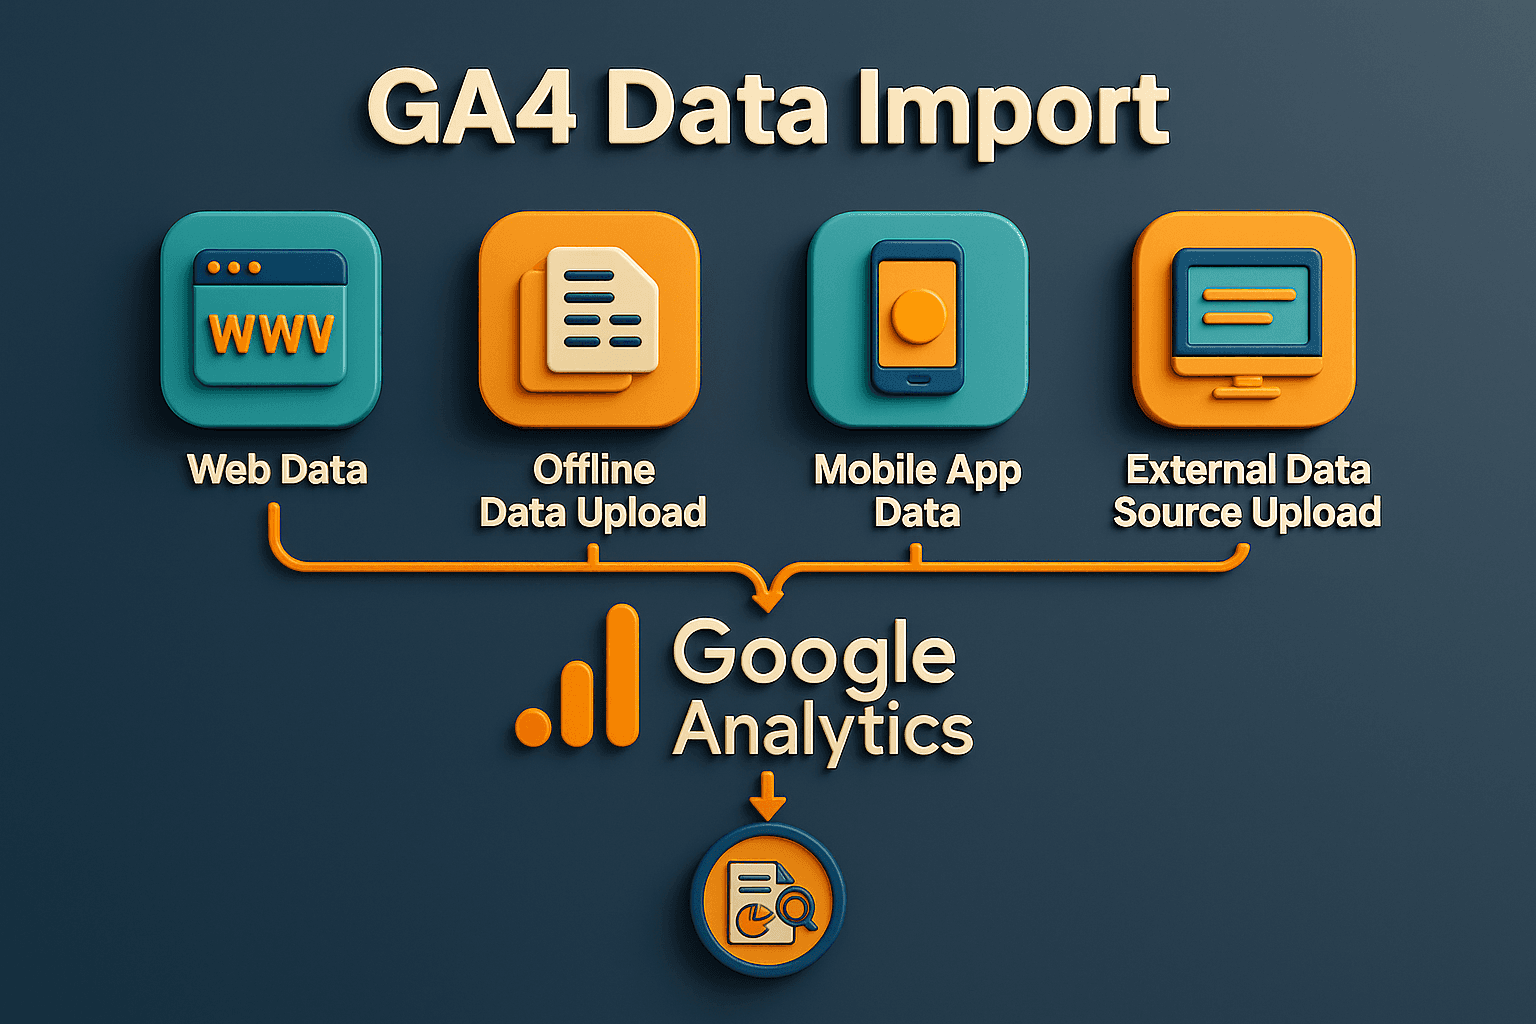
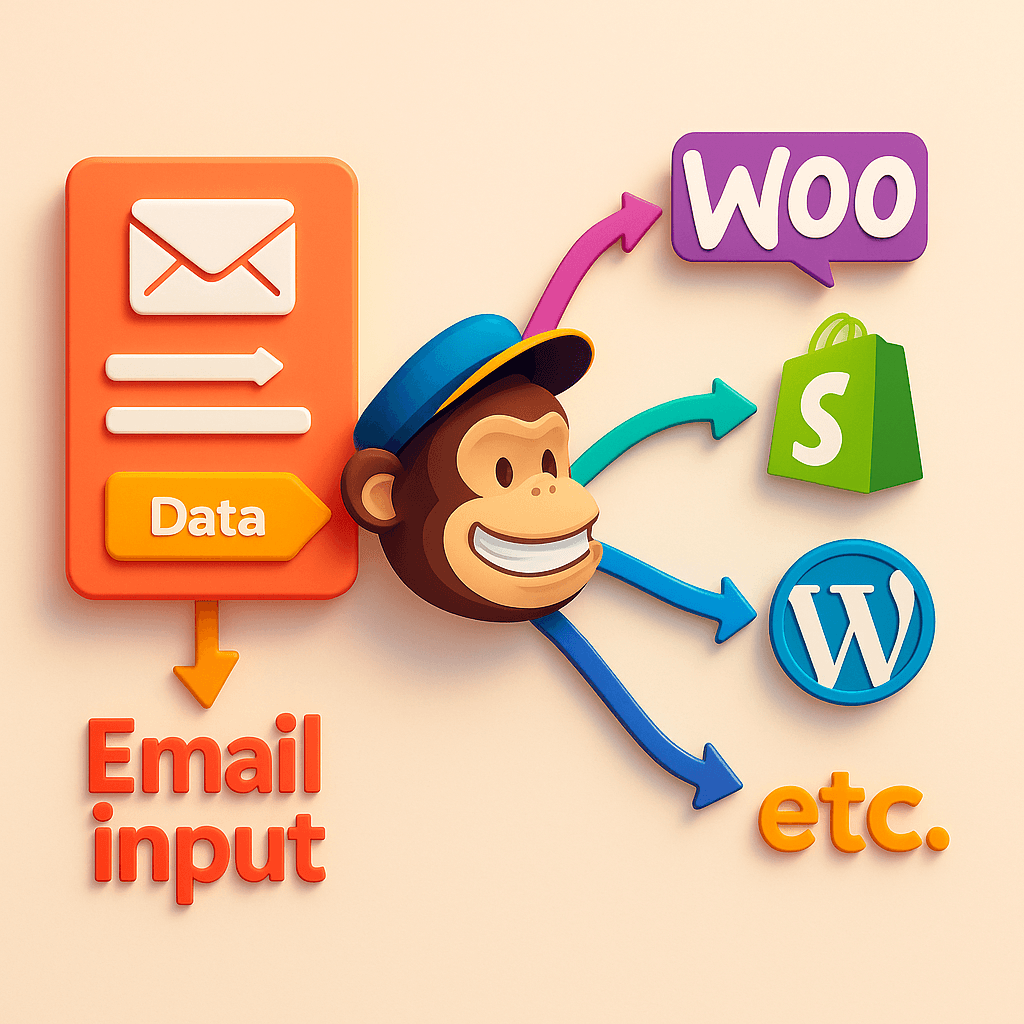
Multi-Source Integration
Combine data from Google Analytics, Shopify, HubSpot, SQL databases, flat files, APIs, and more
Establish a single source of truth that supports all your reporting layers
ETL (Extract, Transform, Load) Workflow Development
Build repeatable, automated ETL pipelines using tools like BigQuery, Dataform, Python, or Airbyte
Define dependencies, triggers, and data refresh frequencies
Cloud & Database Integration
Connect to data lakes and warehouses: BigQuery, AWS RDS, Azure SQL, Snowflake
Sync real-time or batched data flows from web, CRM, ads, and product tools
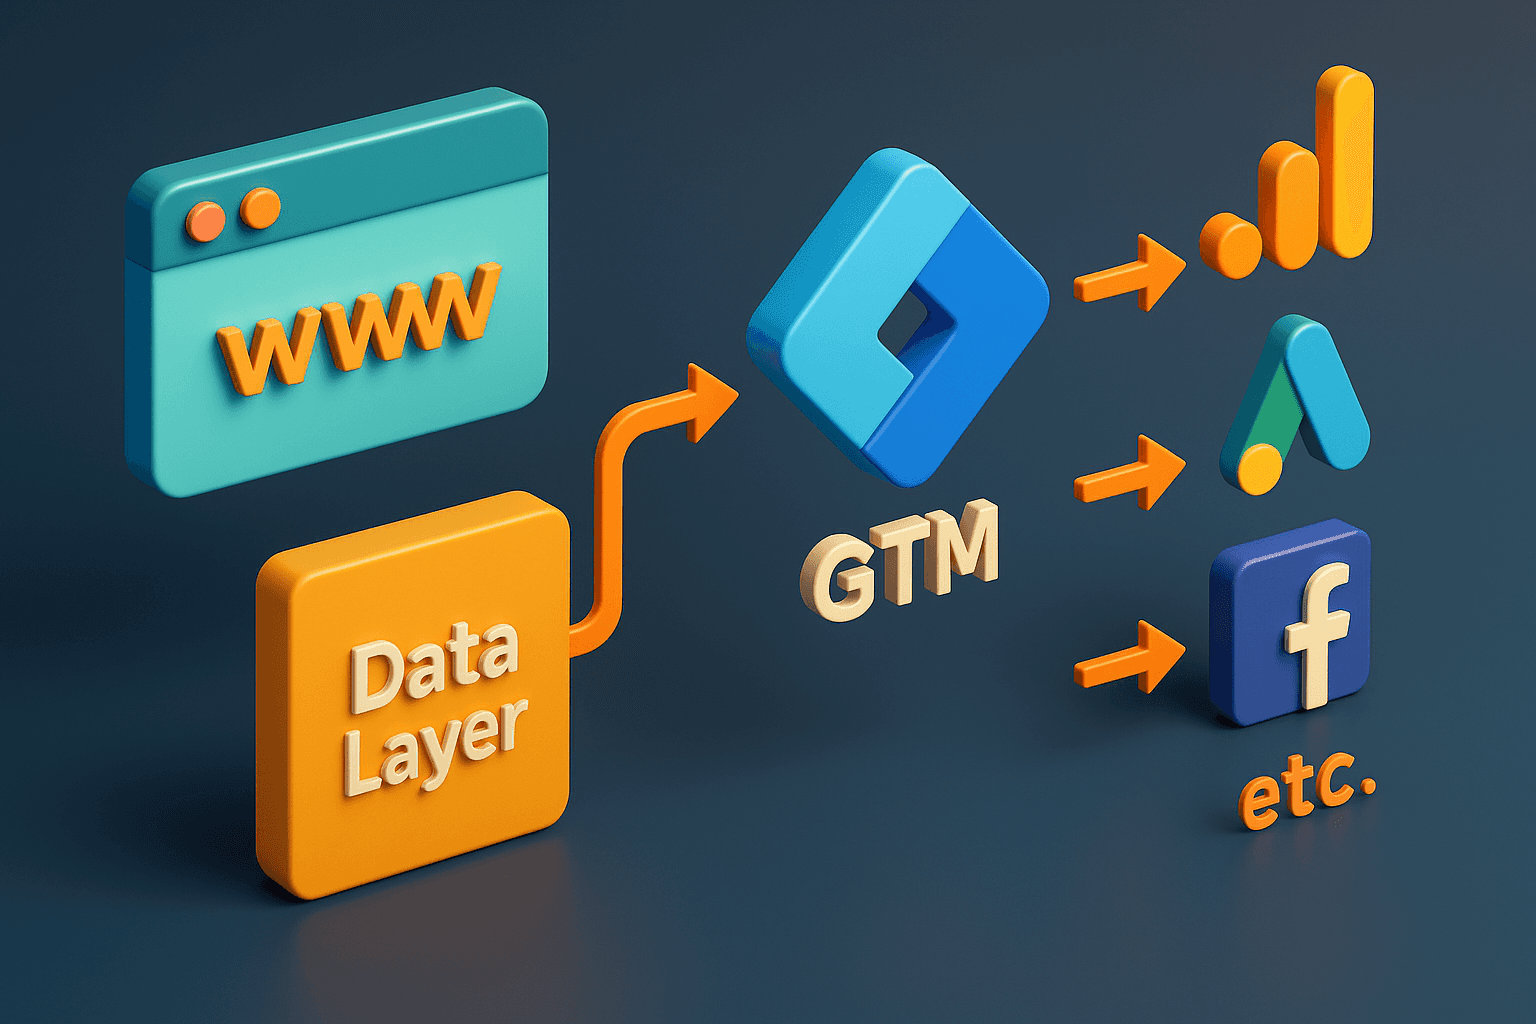
Custom API & Connector Development
Build connectors for custom or niche tools (e.g., legacy CRMs, in-house apps)
Handle authentication, pagination, rate limits, and schema conversion
Data Modelling for BI
Structure data tables for reporting in Looker Studio, Tableau, and Power BI
Create reusable views, metrics layers, and lookup tables
Common Challenges We Solve
Manual reporting tasks and error-prone data merges
Slow dashboards due to inefficient queries or bloated models
Inconsistent logic across platforms (e.g., “conversions” defined differently)
Inability to segment or filter reports effectively
No visibility into backend data processes
Who We Help
Marketing Teams: Combine ad spend, CRM leads, and conversions across platforms
Sales Teams: Integrate pipeline stages, revenue forecasts, and attribution models
Product Teams: Merge usage analytics with support tickets and NPS surveys
Executives: Get unified reporting with real KPIs, not spreadsheets
Real-World Examples
Retail: Combine POS, Shopify, and Google Ads data into a unified sales dashboard
SaaS: Build SQL models linking trial users, CRM entries, and Stripe subscriptions
Agencies: Standardise reporting templates across multiple client accounts
What YouGain
A single version of the truth
Faster, more reliable dashboards
Repeatable workflows that scale
Confidence in every report you send
Like it, Share it: