Data Visualisation
Turn Complex Data into Actionable Insight
Dashboards are the lens through which your business sees performance. But raw data alone doesn’t tell a story. CDF Analytics specialises in transforming datasets from across your digital ecosystem into intelligent, actionable visual dashboards that help your team make decisions with speed and confidence.Whether you're a CMO needing cross-channel ROI, a product manager tracking feature adoption, or a founder watching sales and churn, we create visualisation tools that are tailored, intuitive, and precise.
Why Data Visualisation Matters
Clarity: Cut through the noise to see what matters most
Speed: Get decision-ready data without needing analysts to interpret
Alignment: Ensure every team sees the same KPIs
Impact: Help stakeholders grasp insights quickly and take action
Engagement: Interactive dashboards invite exploration, not just observation
What We Build
Custom Dashboards
Designed using Looker Studio, Power BI, or Tableau
Tailored views for executives, marketing, sales, product, and support
White-labeled or branded to match your business identity
Real-Time Monitoring Panels
Live performance dashboards for eCommerce sales, campaign metrics, support tickets, and more
Refresh automatically with hourly, daily, or real-time intervals
Interactive Visual Reports
Filter by date, channel, user type, region, campaign, and custom metrics
Embedded narratives and visual cues to explain trends
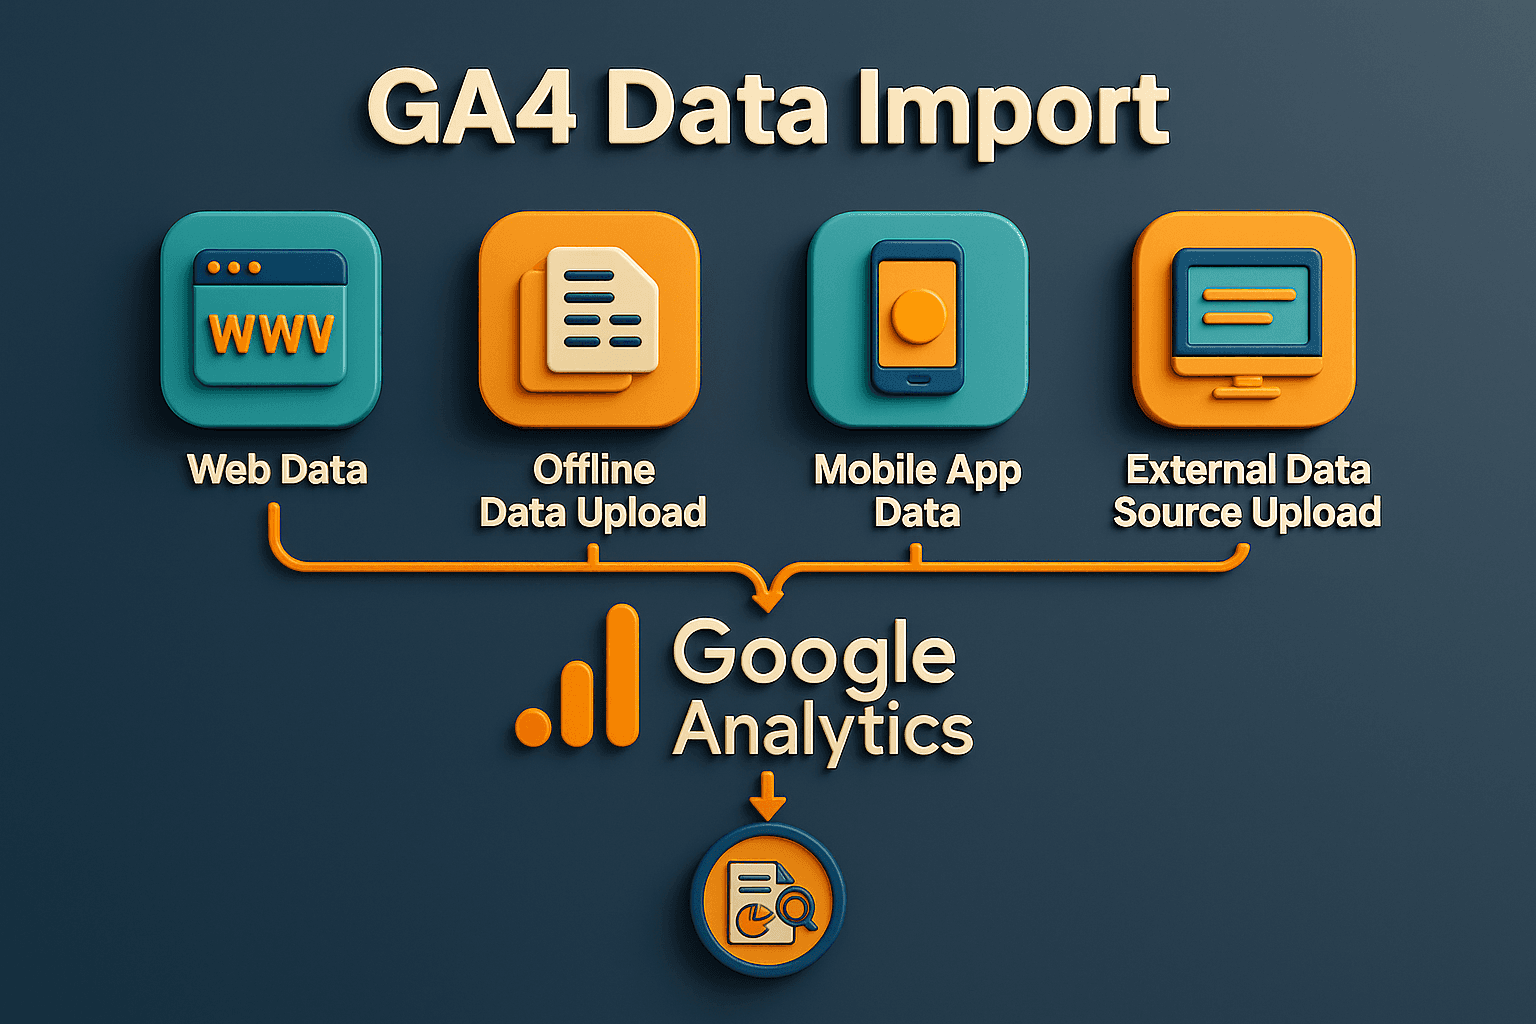
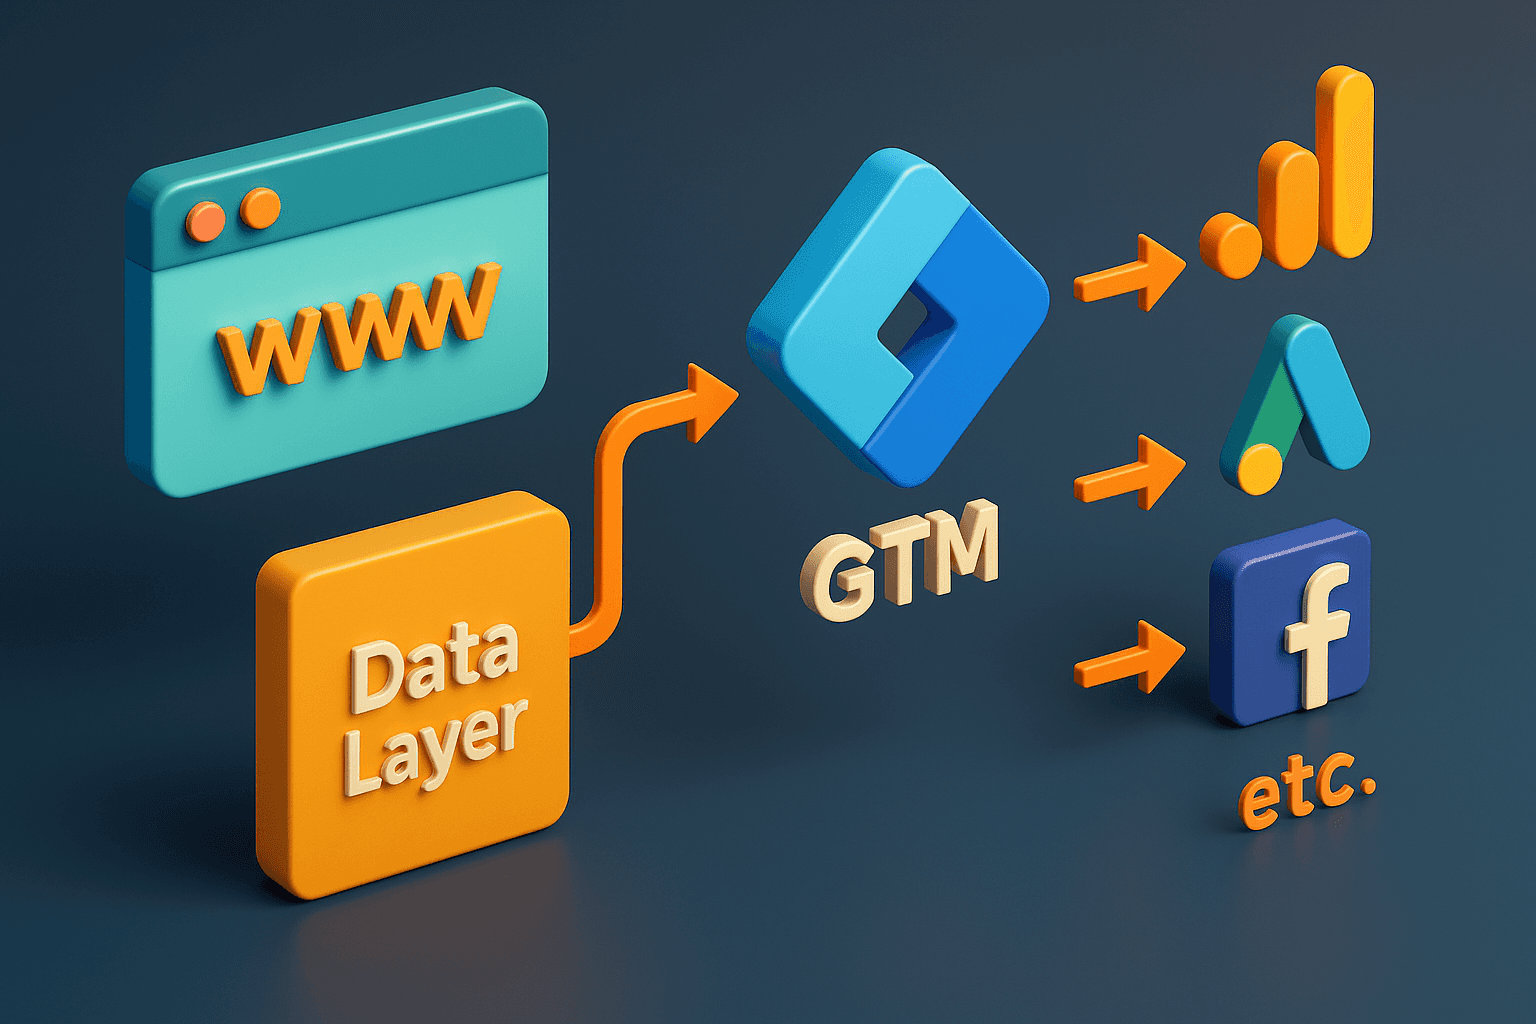
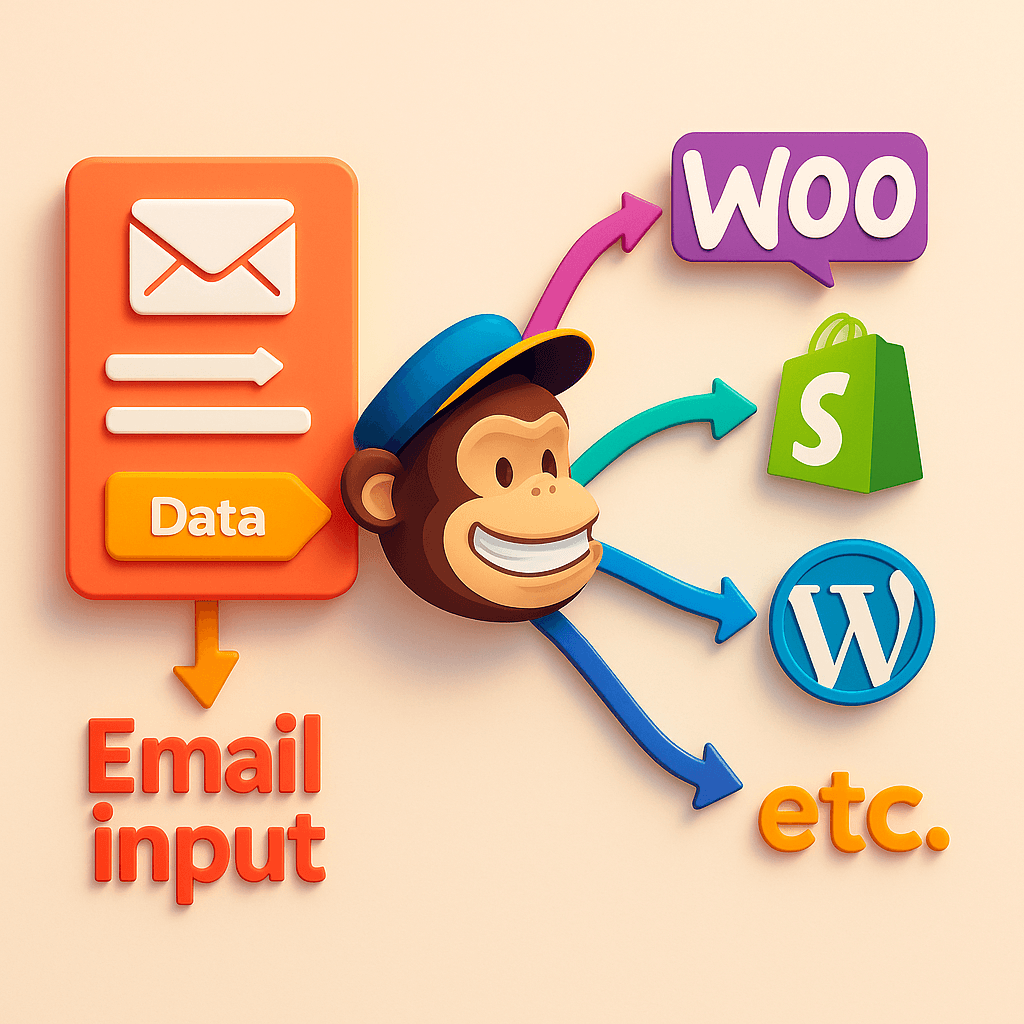
Multi-Source Data Integration
Unified views combining GA4, CRM, eCommerce, advertising, and product usage data
No-code integrations or direct API connections as needed
Visual Funnel & Conversion Path Reporting
Map out journeys and drop-offs in lead funnels, checkout flows, and onboarding processes
Compare behaviour across channels, campaigns, or audience segments
Secure Sharing & Access Controls
Share with stakeholders via web links or scheduled PDFs
Role-based access to sensitive metrics
Executive KPI Summaries
High-level overviews for boards or investors, updated automatically
Charts, heat maps, and trend lines are designed for quick scanning
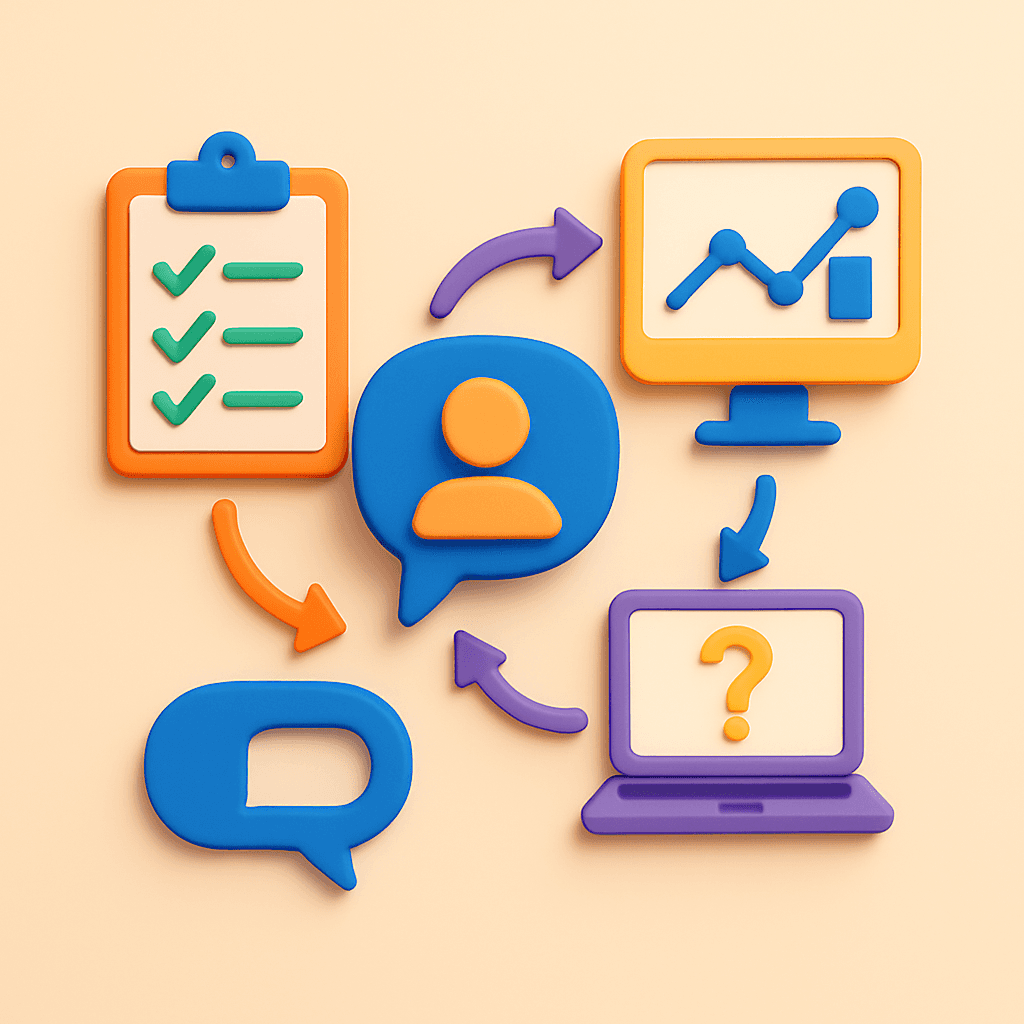
Our Process
Goals & Audience Discovery
Understand who needs the dashboard and why
Define the actions and decisions it should support
Data Audit & Structuring
Identify gaps, inconsistencies, and key sources
Clean and model data to be report-ready
Wireframe & Design Prototyping
Sketch layouts and user journeys before development
Align visual styles with branding and internal tools
Build & Test
Built with proper filters, permissions, and refresh cycles
Validate every metric and label with stakeholders
Training & Rollout
Train teams on how to use and explore the dashboards
Build documentation and embed dashboards into existing workflows
Real-World Examples
Ecommerce: Monitor sales, ROAS, and product conversion by ad source
B2B SaaS: Visualise marketing funnel, MQL to SQL pipeline, churn and LTV
Media/Publishing: Track article performance, referral traffic, and subscriber behaviour
Education: Track course completions, session time,and lead generation by content asset
What You Gain
Clarity on performance across every department
Empowered teams that can make decisions in real-time
Elimination of manual spreadsheet reporting
Visual alignment around your most important metrics
Like it, Share it: